How to make visual changes to the graphs?#
Changing the colour palette#
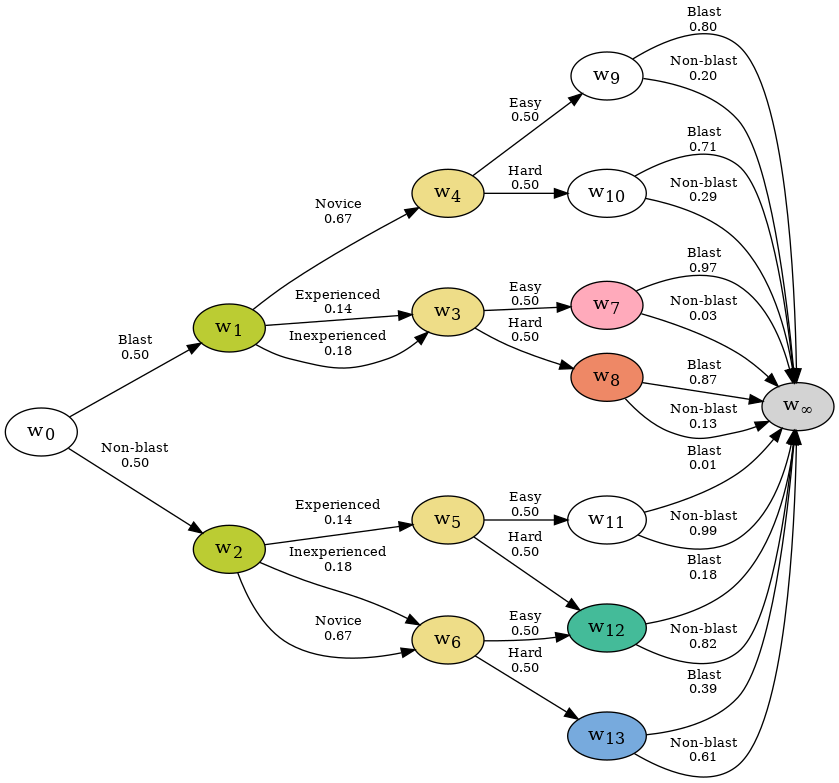
By default, the colours of the nodes in cegpy are selected uniformly at random from the entire spectrum of colours. If we want to use a specific colour palette, a list of colours to be used by the AHC algorithm can be specified as a parameter when calling the create_AHC_transitions method, for example:
from cegpy import StagedTree, ChainEventGraph
import pandas as pd

df = pd.read_excel('../../data/medical_dm_modified.xlsx')

st = StagedTree(df)
colours = ['#BBCC33','#77AADD','#EE8866','#EEDD88','#FFAABB','#44BB99']
st.calculate_AHC_transitions(colour_list=colours)
ceg = ChainEventGraph(st)
ceg.create_figure()
Modifying graph, node, and edge attributes#
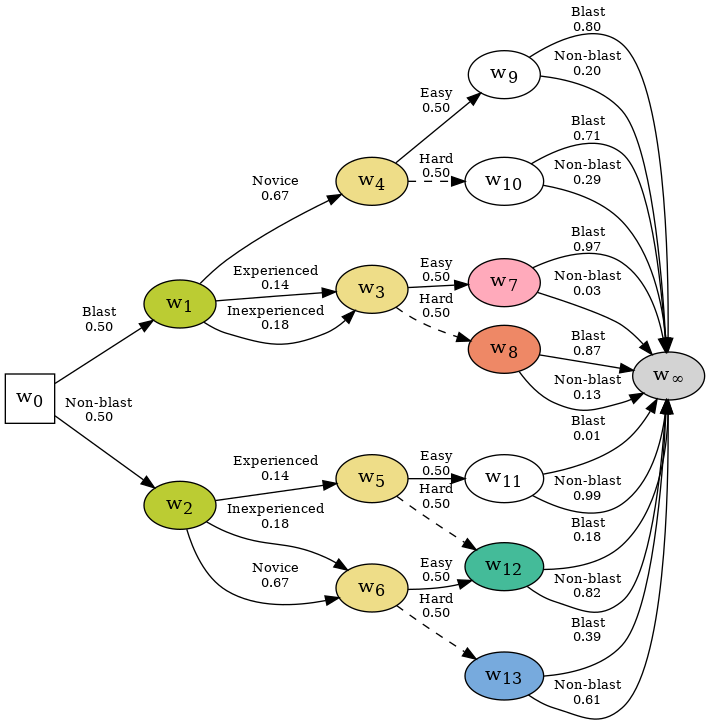
The graphs in cegpy are built with GraphViz and PyDotPlus. We can access the underlying pydotplus.graphviz.Dot object by accessing the dot_graph property. This enables visual modifications of our event tree, staged tree, or CEG. For example, the following code modifies the distance between the nodes, changes the style of each edge labelled "Hard" from solid to dashed, and changes the shape of the root node from oval to square.
from IPython.display import Image

g = ceg.dot_graph()
g.set('ranksep', 0.1)
g.set('nodesep', 0.2)

for edge in g.get_edge_list():
    if "Hard" in edge.get("label"):
        edge.set_style('dashed')

g.get_node('w0')[-1].set_shape('square')

Image(g.create_png())
For more information about the available graph, node, and edge attributes refer to the GraphViz and PyDotPlus documentation.