Creation of a Staged Tree#
EventTree Class#
The first step in constructing a Chain Event Graph (CEG) is to create an event tree describing the process being studied. An event tree is a directed tree graph with a single root node. The nodes with no emanating edges are called leaves, and the non-leaf nodes are called situations.
In this example we work with a data set of four categorical variables: Classification, Group, Difficulty, and Response.
Each individual is given a binary classification - Blast or Non-blast - and are rated on their experience level - Experienced, Inexperienced, or Novice. The classification task they are given has a difficulty rating of Easy or Hard and the response can be either Blast or Non-blast.
We begin by importing the data set and initializing the EventTree object, as shown below:
from cegpy import EventTree
import pandas as pd

df = pd.read_excel('../../data/medical_dm_modified.xlsx')
print(df.head())

#initialize the event tree
et = EventTree(df)
  Classification        Group Difficulty   Response
0          Blast  Experienced       Easy      Blast
1      Non-blast  Experienced       Easy  Non-blast
2      Non-blast  Experienced       Hard      Blast
3      Non-blast  Experienced       Hard  Non-blast
4          Blast  Experienced       Easy      Blast
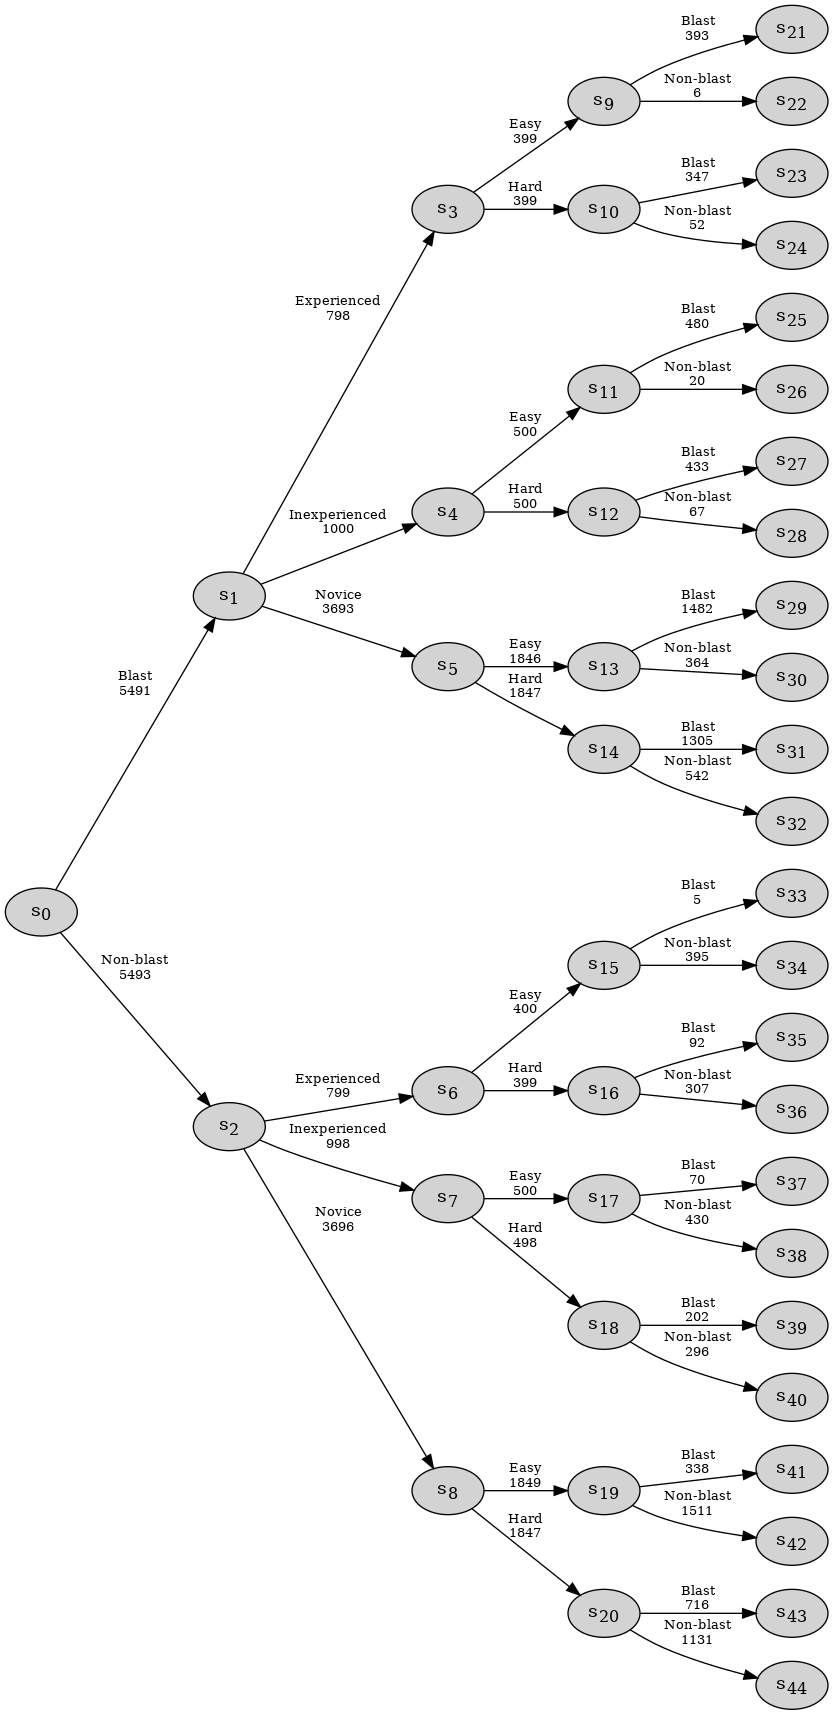
In order to display the EventTree, we can use the method create_figure(). The numbers above the edges of the event tree represent the number of individuals who passed through the given edge.
et.create_figure()
StagedTree Class#
In an event tree, each situation is associated with a transition parameter vector which gives the conditional probability distribution of an individual, who has arrived at the situation, going along each of its edges. In order to create a CEG, we first need to select a staged tree. A staged tree is a probabilistic model which partitions the situations of an event tree into stages. A stage is a collection of situations in the event tree whose immediate evolutions, i.e. their associated transition parameter vectors, are equivalent. To display this symmetry, all situations in the same stage are assigned a single colour.
Selection of a stage tree model for a given event tree can be done using any suitable model selection algorithm. Currently, the only available selection algorithm in cegpy is the Agglomerative Hierarchical Clustering (AHC) algorithm (Freeman and Smith, 2011).
In order to create a staged tree in cegpy we first initialize a StagedTree object from the dataset and then run the AHC algorithm using the create_AHC_transitions method, as displayed below. The output of the AHC algorithm is a dictionary containing the:
Merged Situations- a list of tuples representing the partition of the situations into stagesLog Likelihood- the log likelihood of the data under the model selected by AHC
from cegpy import StagedTree

st = StagedTree(df)
st.calculate_AHC_transitions()
{'Merged Situations': [('s1', 's2'),
  ('s18', 's20'),
  ('s10', 's12'),
  ('s3', 's4', 's5', 's6', 's7', 's8'),
  ('s9', 's11'),
  ('s16', 's17', 's19'),
  ('s0',),
  ('s13',),
  ('s14',),
  ('s15',)],
 'Log Likelihood': np.float64(-30091.353114865367)}
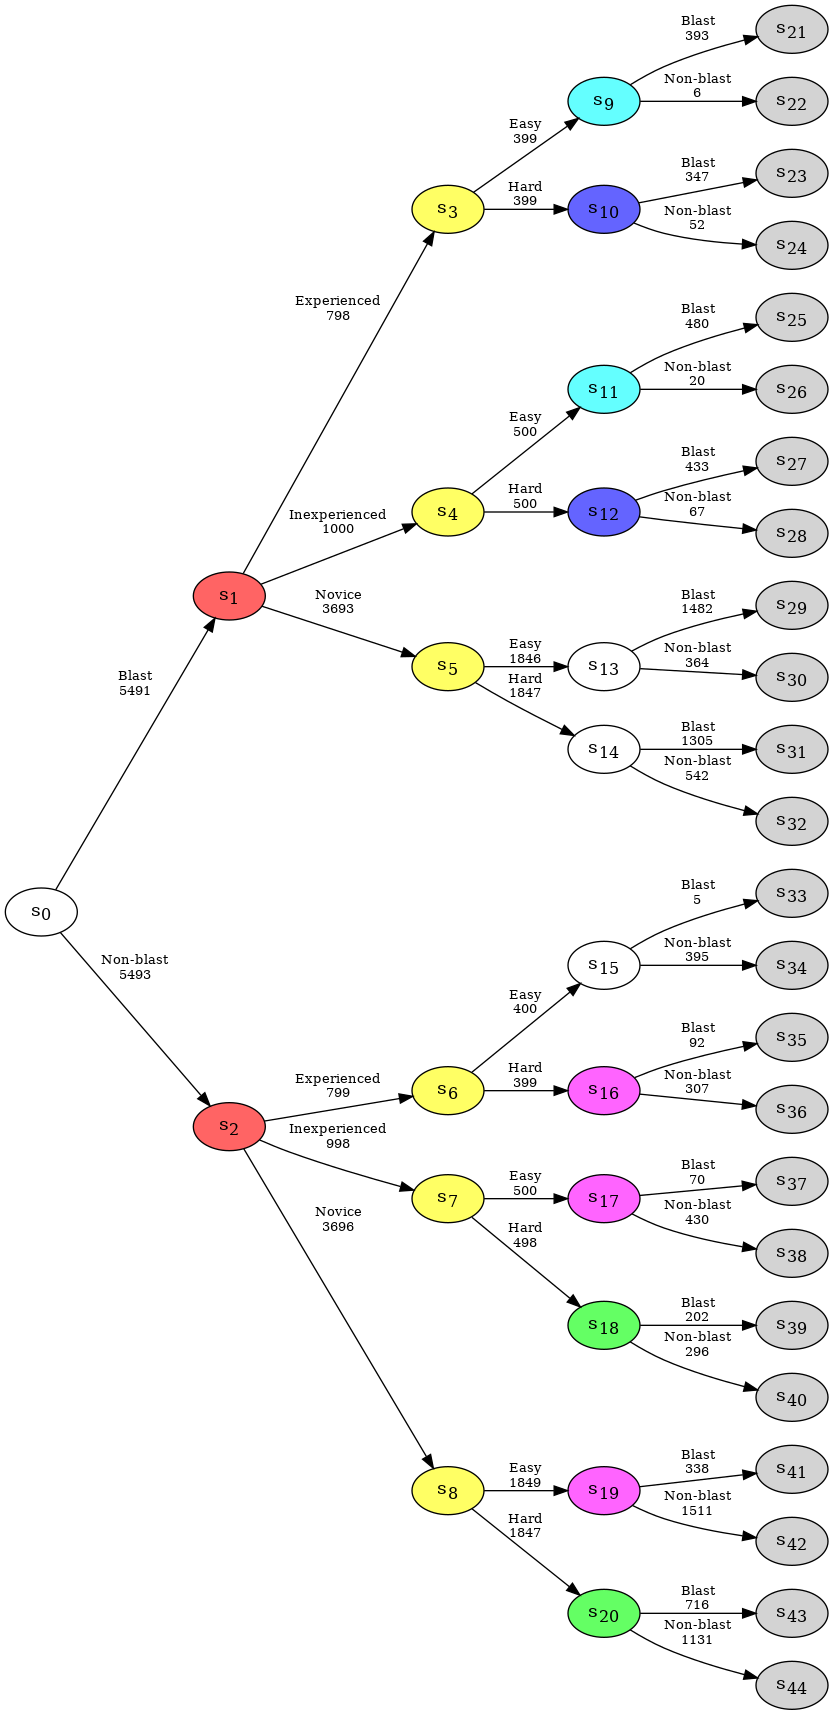
Within cegpy, singleton stages, i.e. stages containing a single situation, are coloured white, while the leaves are coloured in light-grey. Running AHC on our data set results in the following staged tree.
st.create_figure()
Custom Hyperstages#
cegpy allows the user to specify which situations are allowed to be placed in the same stage by the AHC algorithm. This is done by specifying a hyperstage (Collazo et al., 2017) which is a collection of sets such that two situations cannot be in the same stage unless they belong to the same set in the hyperstage. Under a default setting in cegpy, all situations which have the same number of outgoing edges and equivalent set of edge labels are in the same set within the hyperstage. The default hyperstages of a given tree can be displayed by accessing the hyperstage property, which returns a list of lists, where each sublist contains situations belonging to the same hyperstage.
st.hyperstage
[['s0',
  's9',
  's10',
  's11',
  's12',
  's13',
  's14',
  's15',
  's16',
  's17',
  's18',
  's19',
  's20'],
 ['s1', 's2'],
 ['s3', 's4', 's5', 's6', 's7', 's8']]
In this example, situations \(s_1\) and \(s_2\) belong to the same hyperstage. Both of them have three emanating edges with labels Experienced, Inexperienced, and Novice. However, stages \(s_6\) and \(s_{15}\) belong to different hyperstages. They both have two emanating edges, yet different labels: Easy, Hard and Blast, Non-blast.
We can specify a different hyperstage at the point of running the AHC algorithm by passing a list defining the hyperstage partition as a parameter to the calculate_AHC_transitions method, for example separating the binary classification at \(s_0\) from the response:
new_hyperstage = [
    ['s0'],
    ['s1', 's2'],
    ['s3', 's4', 's5', 's6', 's7', 's8'],
    ['s9', 's10', 's11', 's12', 's13', 's14', 's15', 's16', 's17', 's18', 's19','s20'],
]
st.calculate_AHC_transitions(hyperstage=new_hyperstage)
{'Merged Situations': [('s1', 's2'),
  ('s18', 's20'),
  ('s10', 's12'),
  ('s3', 's4', 's5', 's6', 's7', 's8'),
  ('s9', 's11'),
  ('s16', 's17', 's19'),
  ('s0',),
  ('s13',),
  ('s14',),
  ('s15',)],
 'Log Likelihood': np.float64(-30091.353114865367)}
Initial staging#
By default, the AHC algorithm initialises with all situations in different stages. It then greadily merges pairs of stages until the scoring function cannot be increased further. In this way it is possible, a priori, for any two situations in the same hyperstage to be put in the same stage. However, sometimes prior information is available, through either elicited expert knowledge or previous studies, that says two situations are in the same stage. In this case, the corresponding situations should be placed in the same stage regardless of the data or model selection algorithm.
This can be done in cegpy using the initial_staging argument within calculate_AHC_transitions. The initial_staging is a list of lists where each sublist is a group of situations (that must be in the same hyperstage) that are forced to be in the same stage. Note that not every situation has to appear in the initial_staging, only those that should be merged a-priori.
The AHC algorithm is then initialised with the stages specified in initial_staging. Because the AHC algorithm does not allow stages to be split in the search, these merged situations will remain in the final selected model.
For example, suppose we know a-priori that for experienced individuals, the response does not depend on the difficulty of the classification task. That is, \(s_9\) and \(s_{10}\) must be in the same stage, as well as \(s_{15}\) and \(s_{16}\). This is implemented using the initial_staging as shown below. Notice that the relevant situations remain in the same stage after execution of the AHC algorithm.
new_initial_staging = [
    ['s9', 's10'],
    ['s15', 's16'],
]
st.calculate_AHC_transitions(initial_staging=new_initial_staging)
{'Merged Situations': [('s1', 's2'),
  ('s18', 's20'),
  ('s3', 's4', 's5', 's6', 's7', 's8'),
  ('s15', 's16', 's17'),
  ('s9', 's10', 's11'),
  ('s0',),
  ('s12',),
  ('s13',),
  ('s14',),
  ('s19',)],
 'Log Likelihood': np.float64(-30163.23639539384)}
Custom staged trees#
cegpy is only able to draw a staged tree and display estimated transition probabilities after running calculate_AHC_transitions. This means that it is only possible to display the staged tree selected by the AHC algorithm.
However, by combining the hyperstage and initial_staging parameters, one is able to draw and estimate transition probabilities of a user defined staged tree.
This might be useful, for example, for comparing two different staged trees or for estimating probabilities in a staged tree where the stages are completely informed by prior information.
To do this, simply write the custom staging as a list of lists and pass this as both the hyperstage and initial_staging parameters in calculate_AHC_transitions. The algorithm is initialised at initial_staging, but because this is identical to hyperstage it is not possible to further merge any stages. Hence the AHC algorithm will terminate immediately with the custom staging.
For example, suppose we wish to combine all situations regarding experience level together and combine all situations regarding difficulty rating, but keep all situations regarding the binary classification and response separate:
custom_staging = [
    ['s0'],
    ['s1', 's2'],
    ['s3', 's4', 's5', 's6', 's7', 's8'],
    ['s9'],
    ['s10'],
    ['s11'],
    ['s12'],
    ['s13'],
    ['s14'],
    ['s15'],
    ['s16'],
    ['s17'],
    ['s18'],
    ['s19'],
    ['s20'],
]
st.calculate_AHC_transitions(hyperstage=custom_staging, initial_staging=custom_staging)
{'Merged Situations': [('s1', 's2'),
  ('s3', 's4', 's5', 's6', 's7', 's8'),
  ('s0',),
  ('s9',),
  ('s10',),
  ('s11',),
  ('s12',),
  ('s13',),
  ('s14',),
  ('s15',),
  ('s16',),
  ('s17',),
  ('s18',),
  ('s19',),
  ('s20',)],
 'Log Likelihood': np.float64(-30103.591134975297)}
Prior parameters#
cegpy uses a Bayesian scoring function within the AHC algorithm and so requires specification of prior distributions for the transition parameter vectors. This is done via conjugate Dirichlet priors and so only requires specification of the Dirichlet parameters for each situation.
The default choice of Dirichlet parameters follows the score equivalence prior for stratified trees (Cowell and Smith, 2014).
The size of the default parameters are controlled by the optional parameter alpha passed to calculate_AHC_transitions. Larger values of alpha give stronger priors and therefore probability estimates that are less sensitive to the data.
Different prior parameters can be provided using the parameter prior in calculate_AHC_transitions. This is in the format of a list of lists where each sublist contains the prior parameters for a situation (ordered by node index) for each outgoing edge (in alphabetical order by edge label). Parameter values must be in the form of a Fraction from the fractions package.
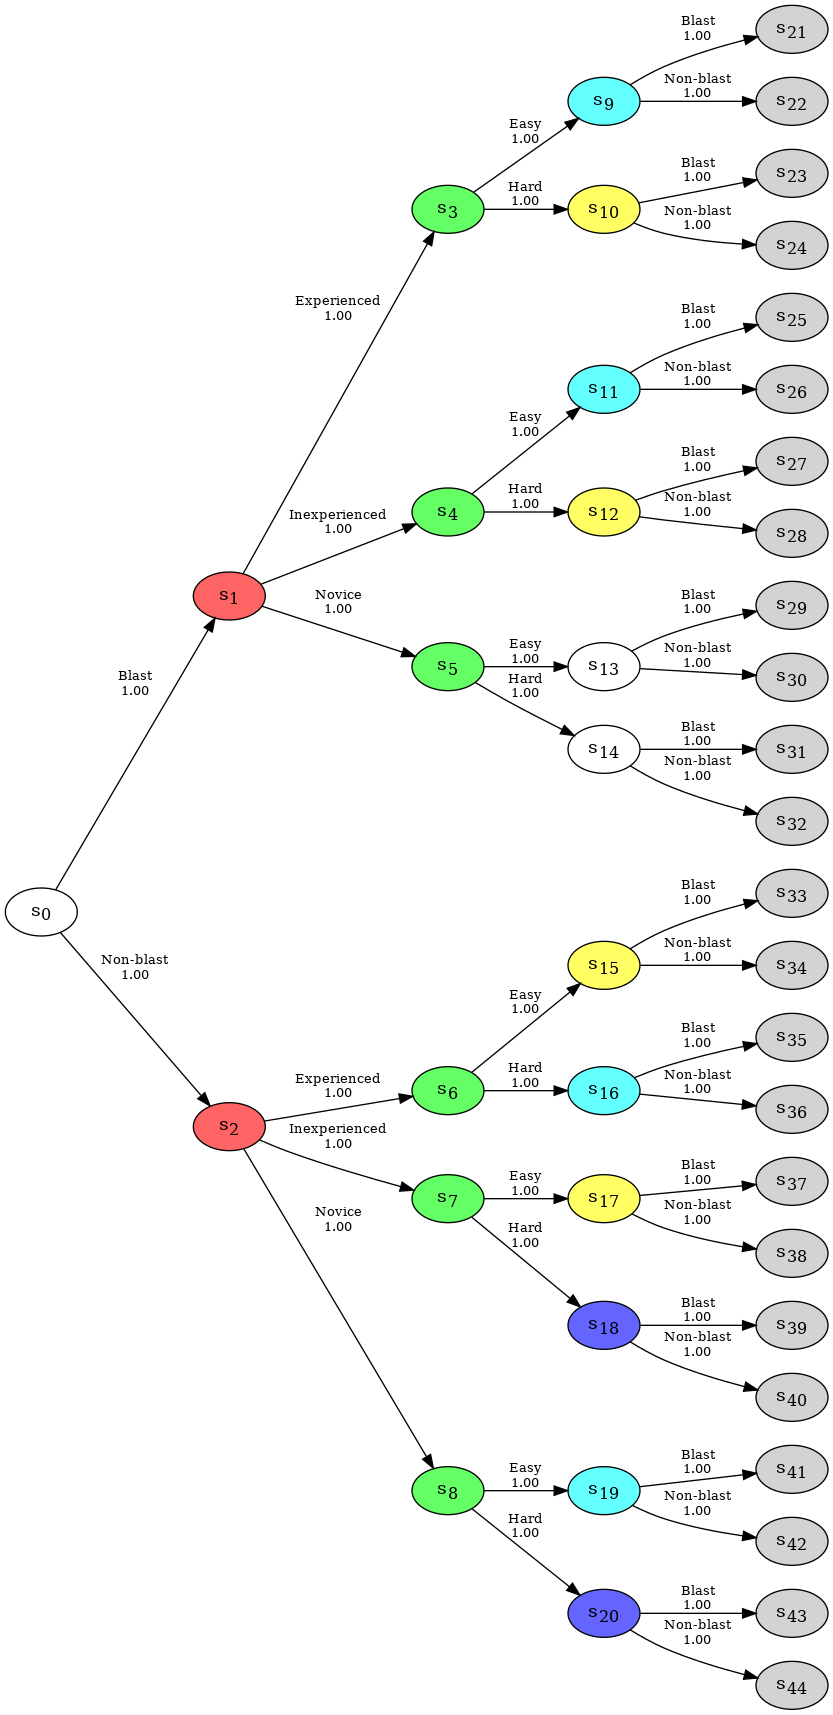
For example, below we make all prior parameters equal to 1. In create_figure, the edge_info parameter can be used to display the ‘prior’ parameters in the staged tree.
from fractions import Fraction
new_prior = list()
new_prior.append([Fraction(1, 1), Fraction(1, 1)])
for i in range(2):
  new_prior.append([Fraction(1, 1), Fraction(1, 1), Fraction(1,1)])
for i in range(18):
  new_prior.append([Fraction(1, 1), Fraction(1, 1)])
st.calculate_AHC_transitions(prior=new_prior)
st.create_figure(edge_info='prior')
Structural and sampling zeros / missing values#
The package, by default, treats all blank and NaN cells as structural missing values, i.e. data that is missing for a logical reason. However, sometimes these instead occur due to sampling limitations; sampling missing values. Similarly, when a certain value for a variable is not observed in the data set (given its ancestral variables), the package by default assumes that this combination of values is impossible to observe - a structural zero. This is represented by the corresponding edge being omitted from the event tree. However, this might instead be a sampling zero - the combination of values is possible but does not appear in the data set.
Consider the following example of the falls.xlsx data set which provides information concerning adults over the age of 65, and includes four categorical variables as given below with their state spaces:
Housing Assessment: Living situation and whether they have been assessed. State space:
{"Communal Assessed", "Communal Not Assessed", "Community Assessed", "Community Not Assessed"};Risk: Risk of a future fall. State space:
{"High Risk", "Low Risk"};Treatment: Referral and treatment status. State space:
{"Not Referred & Not Treated", "Not Referred & Treated", "Referred & Treated"};Fall: The outcome. State space:
{"Fall", "Don’t Fall"}.
df = pd.read_excel('../../data/Falls_Data.xlsx')
df.head()
| HousingAssessment | Risk | Treatment | Fall | |
|---|---|---|---|---|
| 0 | Community Not Assessed | Low Risk | NaN | Fall |
| 1 | Community Not Assessed | High Risk | NaN | Fall |
| 2 | Community Not Assessed | Low Risk | NaN | Don't Fall |
| 3 | Community Not Assessed | Low Risk | NaN | Don't Fall |
| 4 | Community Not Assessed | Low Risk | NaN | Fall |
et = EventTree(df)
et.create_figure()
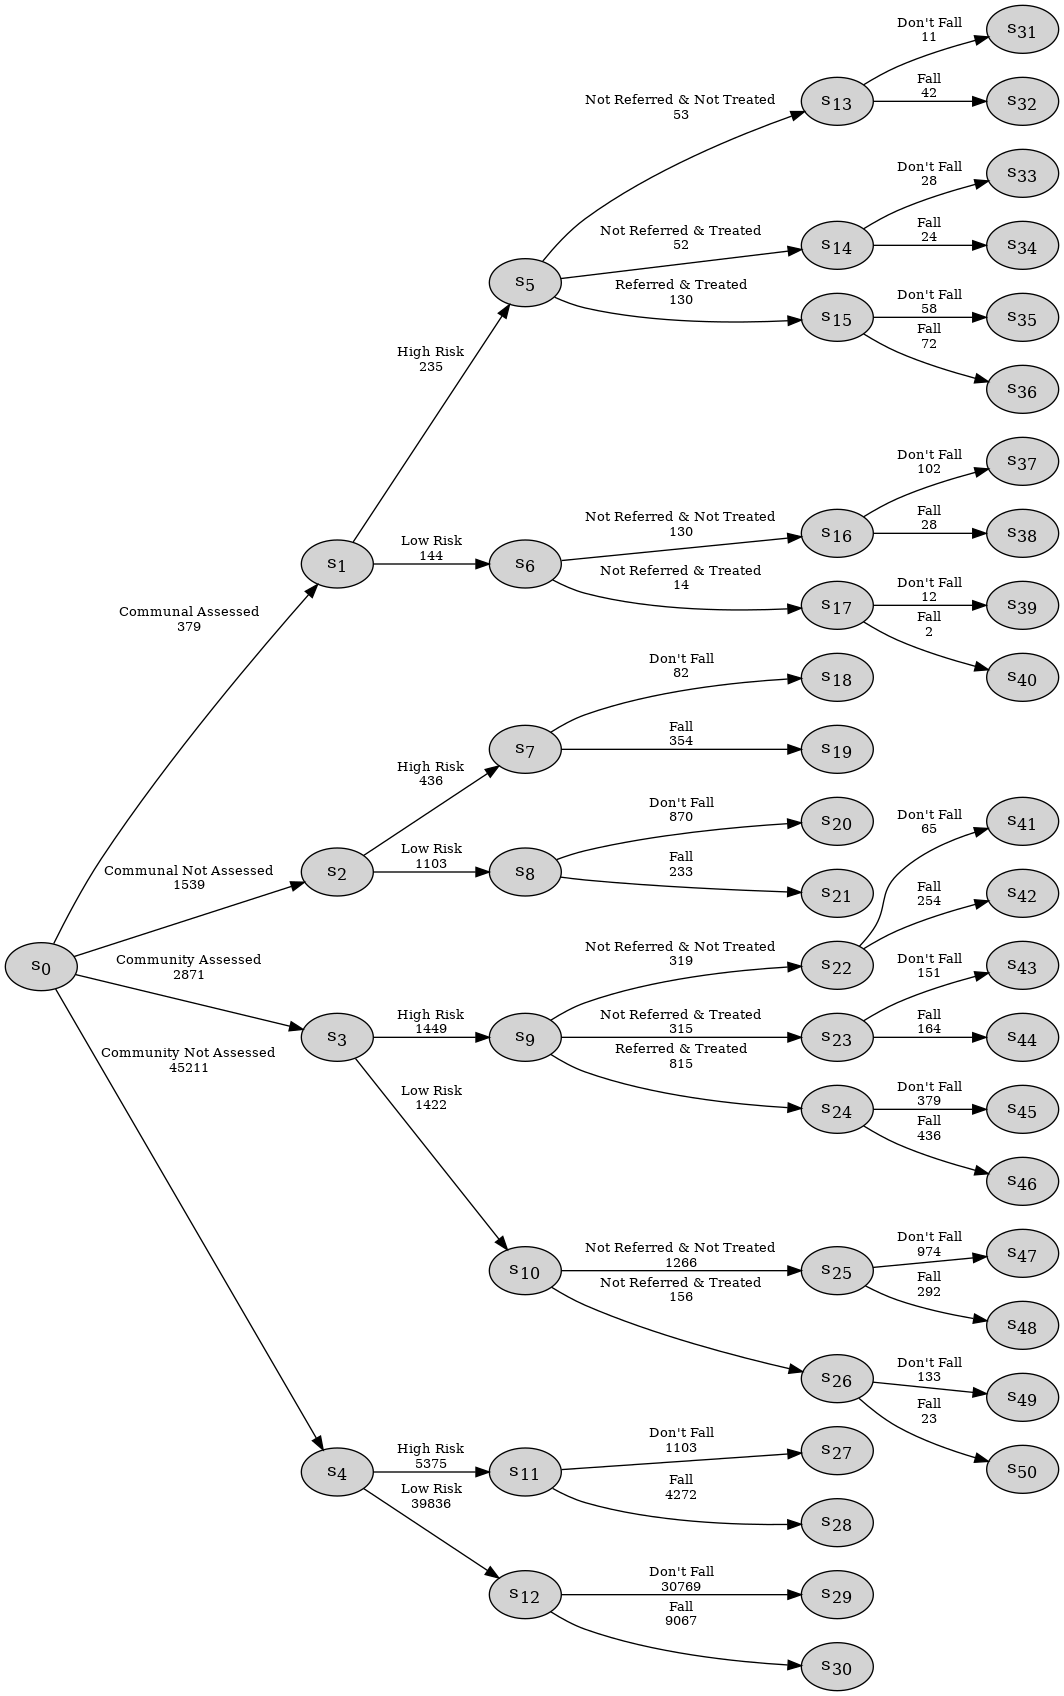
Observe that this process has some asymmetries. None of the individuals assessed to be low risk are referred to the falls clinic and thus, for these groups, the count associated with the Referred & Treated category is zero and these edges are not included in the tree.
df[df.Risk == "Low Risk"]['Treatment'].value_counts()
Treatment
Not Referred & Not Treated    1396
Not Referred & Treated         170
Name: count, dtype: int64
Furthermore, for individuals who are not assessed, the Treatment variable is not recorded and appears as NaN in the dataset:
# Missing values in each column
print(df.isna().sum())

# Missing values for Treatment are structural,
# they are missing due to the lack of assessment:
df[df.HousingAssessment.isin([
    'Community Not Assessed', 'Communal Not Assessed'
])]['Treatment'].isna().sum()
HousingAssessment        0
Risk                     0
Treatment            46750
Fall                     0
dtype: int64
np.int64(46750)
By default, these are assumed to be structural zeros and missing values. That is, individuals assessed as low risk are never referred - a structural zero - and it does not make sense to consider referral and treatment of individuals that are not assessed - structural missing values. If either of these are not the case and the zeros or missing values are due to limitations of the sample, then this can be specified as demonstrated below.
Distinguishing structural and sampling missing values#
Suppose that some individuals in communal establishments that were not formally assessed but were known to be high risk actually received treatment, but that this was not recorded in the dataset. The treatment of such individuals are therefore sampling missing values, while the other blank/NaN cells are structurally missing.
idx = (df.HousingAssessment == 'Communal Not Assessed') & (df.Risk == 'High Risk')
df[idx]
| HousingAssessment | Risk | Treatment | Fall | |
|---|---|---|---|---|
| 67 | Communal Not Assessed | High Risk | NaN | Fall |
| 72 | Communal Not Assessed | High Risk | NaN | Fall |
| 95 | Communal Not Assessed | High Risk | NaN | Fall |
| 102 | Communal Not Assessed | High Risk | NaN | Fall |
| 132 | Communal Not Assessed | High Risk | NaN | Fall |
| ... | ... | ... | ... | ... |
| 49065 | Communal Not Assessed | High Risk | NaN | Fall |
| 49087 | Communal Not Assessed | High Risk | NaN | Fall |
| 49135 | Communal Not Assessed | High Risk | NaN | Don't Fall |
| 49461 | Communal Not Assessed | High Risk | NaN | Fall |
| 49905 | Communal Not Assessed | High Risk | NaN | Fall |
436 rows × 4 columns
To demarcate the difference between structural and sampling missing values, a user can give different labels to the structural and sampling missing values in the dataset and provide these labels to the struct_missing_label and missing_label arguments respectively when initialising the EventTree or StagedTree object.
In our example, we can replace the NaN values for the Treatment variable among the considered subset of data with a new label, e.g. samp_miss:
df.loc[idx, 'Treatment'] = 'samp_miss'
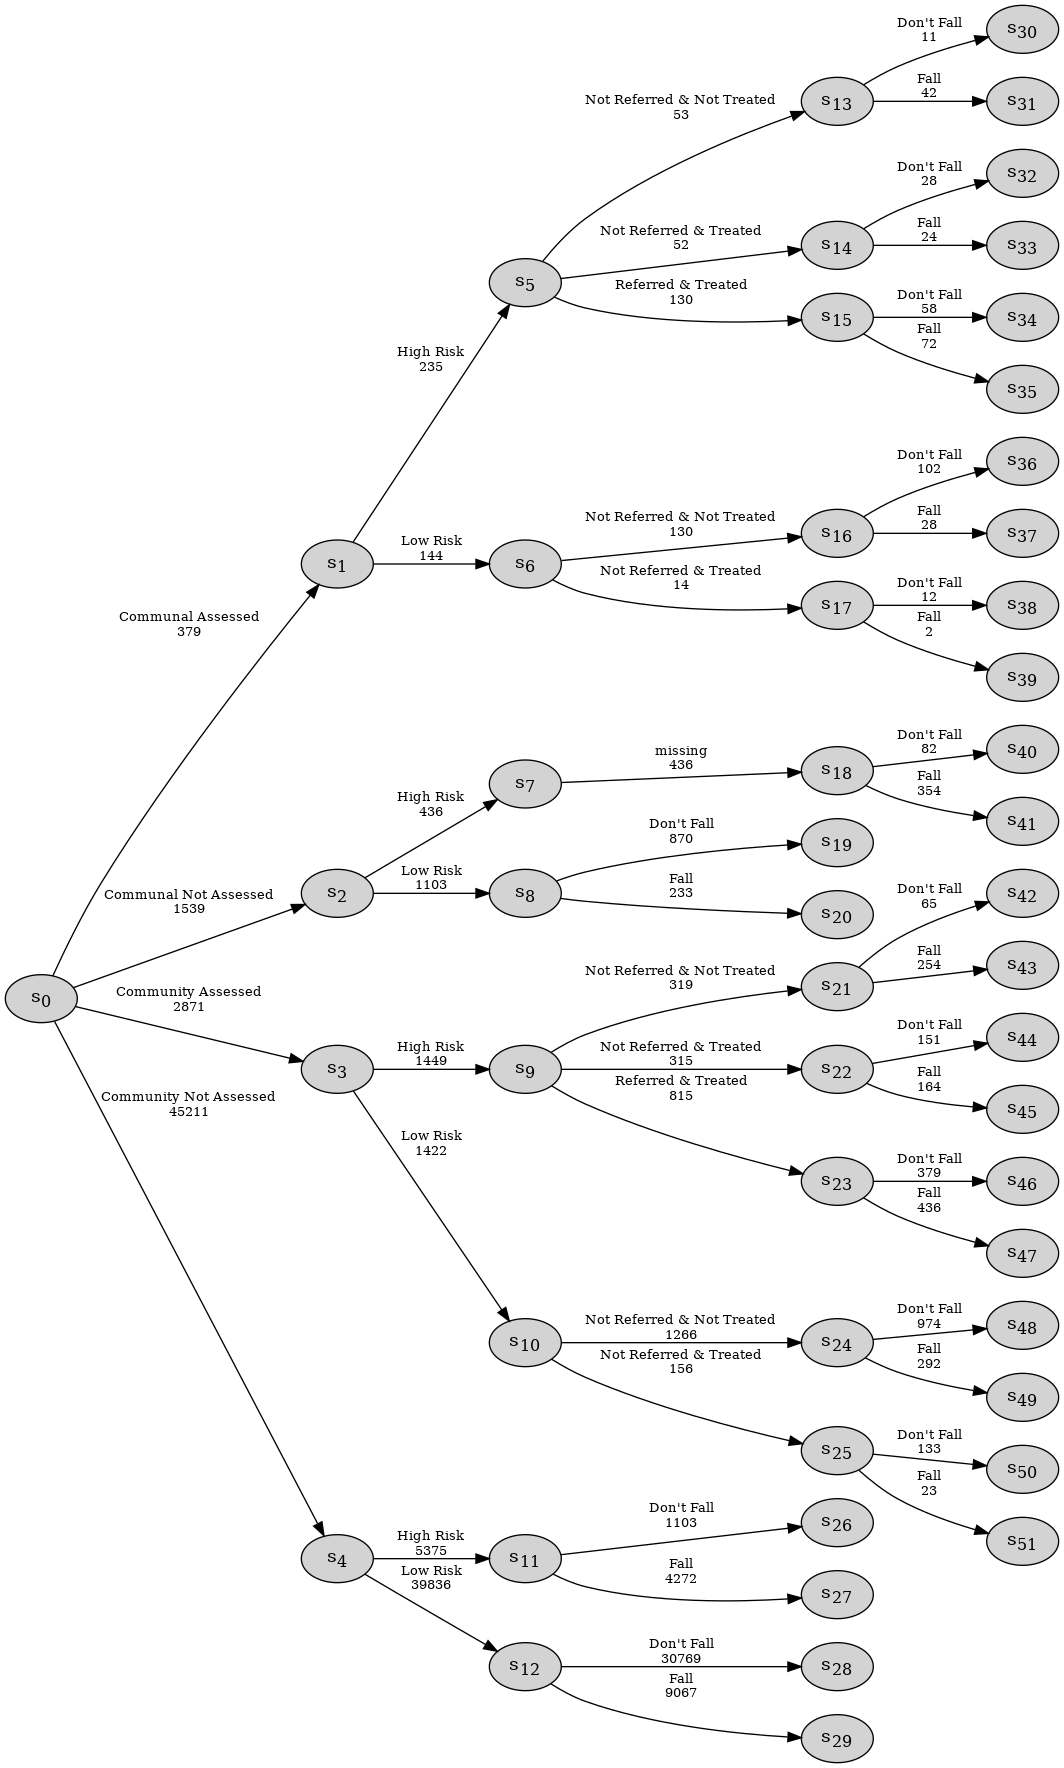
By providing this as the missing_label in the EventTree (or StagedTree) object, the corresponding path - ("Communal Not Assessed", "High Risk", "missing") is added to the event tree:
et2 = EventTree(df,
    missing_label='samp_miss',
)
et2.create_figure()
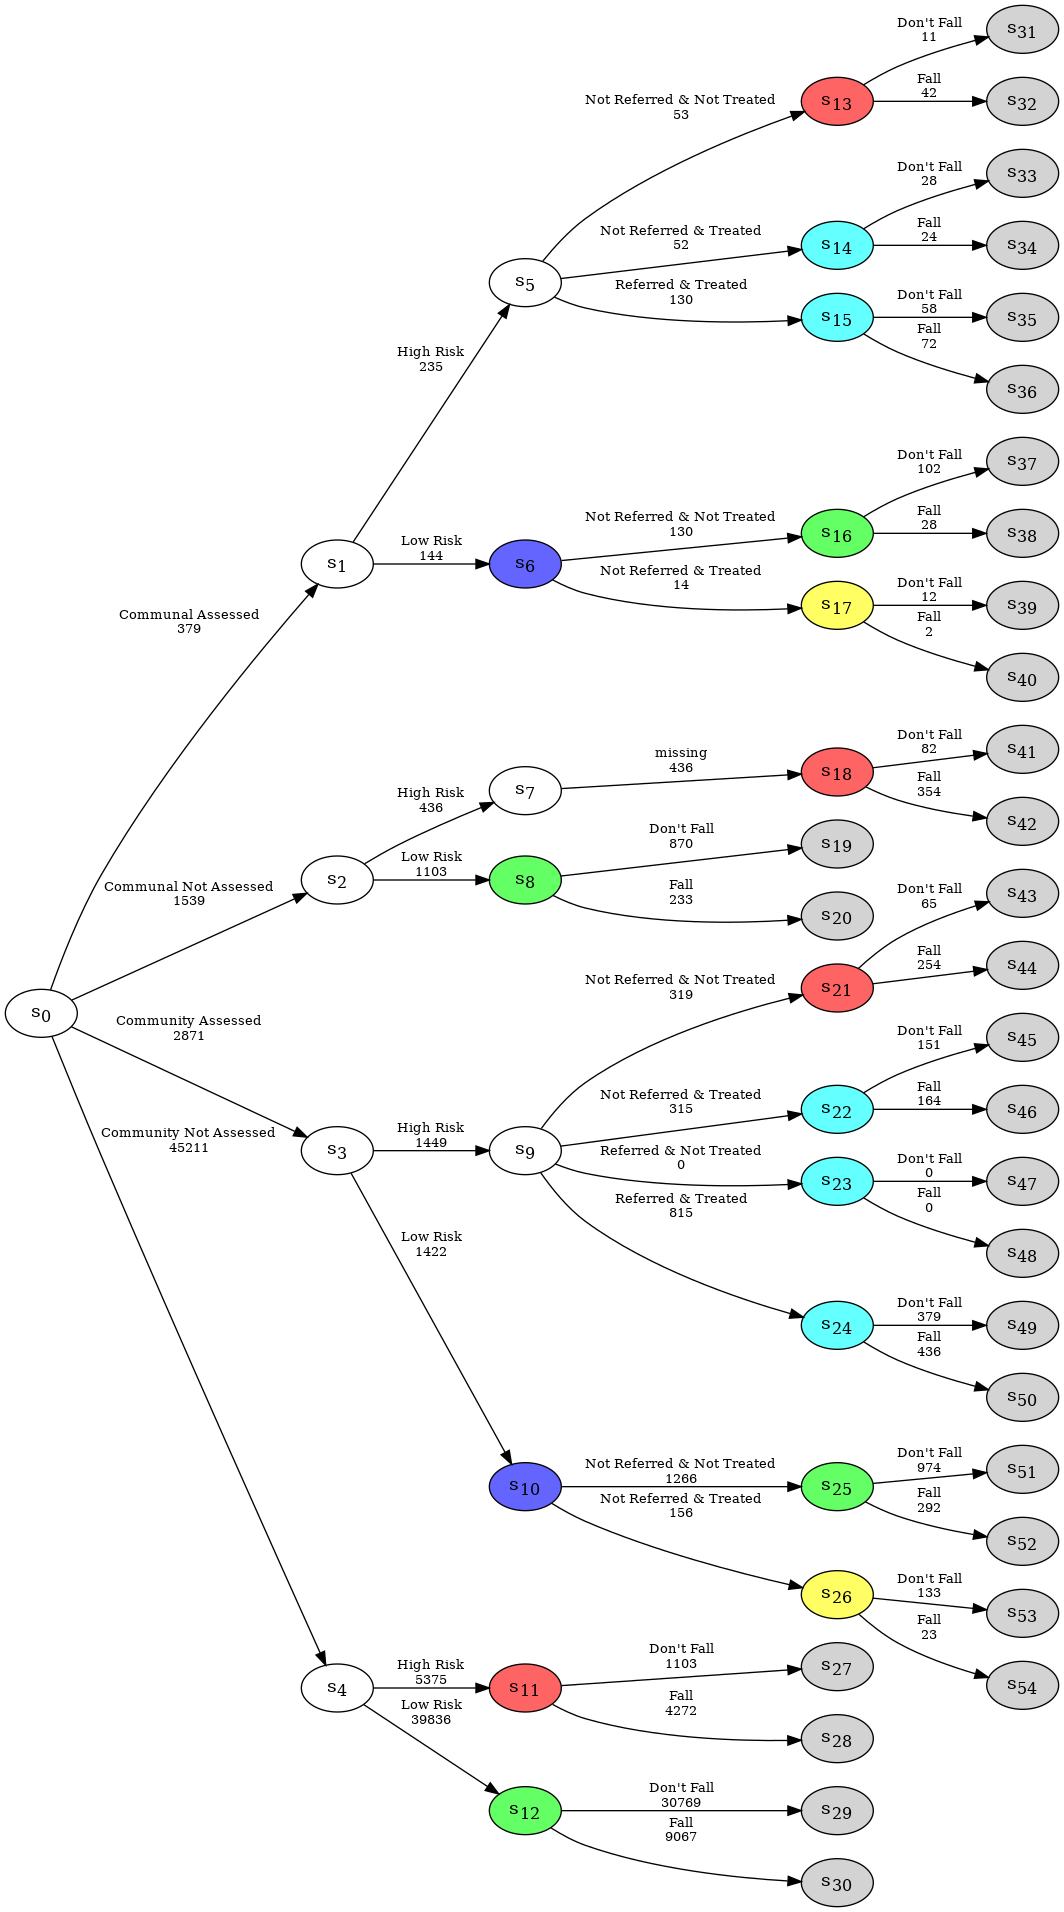
Adding sampling zeros#
Suppose that some individuals in the community who were assessed and high risk were referred and not treated, but that none of these individuals appeared in the dataset. This path ("Community Assessed", "High Risk", "Referred & Not Treated") should appear in the event tree, but because it is not in the dataset this must be done manually. We also need to add in the values that follow it: i.e. ("Community Assessed", "High Risk", "Referred & Not Treated", "Fall") and ("Community Assessed", "High Risk", "Referred & Not Treated", "Don't Fall").
In cegpy any paths that should be in the event tree but are absent from the dataset can be added manually by the user using the sampling_zero_paths argument when initialising the EventTree or StagedTree object. No changes need to be made to the dataset, as shown below:
st2 = StagedTree(df,
    sampling_zero_paths=[
        ('Community Assessed', 'High Risk', 'Referred & Not Treated'),
        ('Community Assessed', 'High Risk', 'Referred & Not Treated', 'Fall'),
        ('Community Assessed', 'High Risk', 'Referred & Not Treated', "Don't Fall")
])
st2.calculate_AHC_transitions()
st2.create_figure()